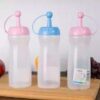


Liquid Soap Dishwasher Brush
₨ 199
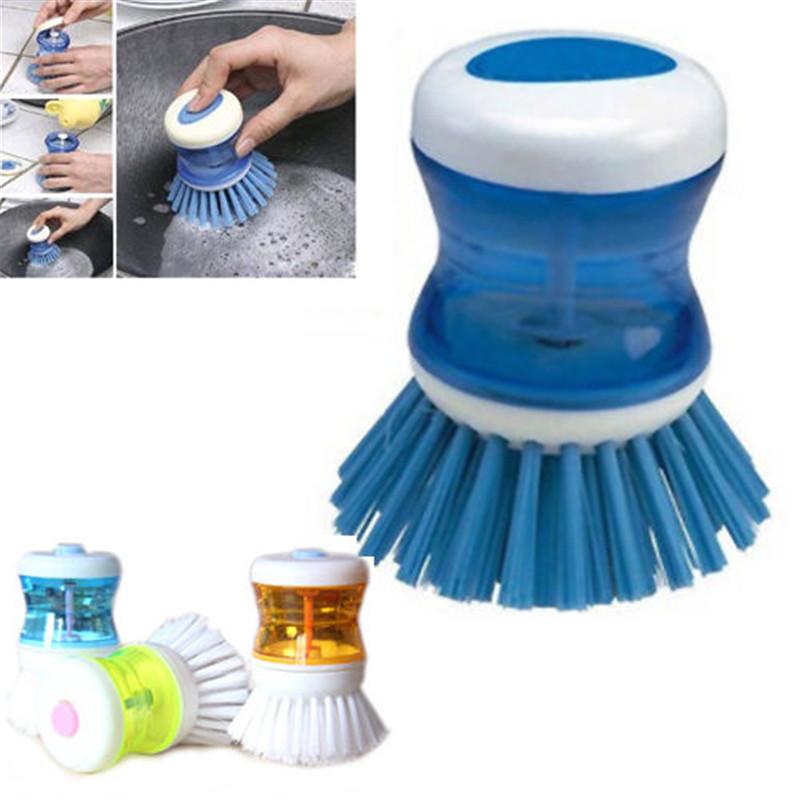
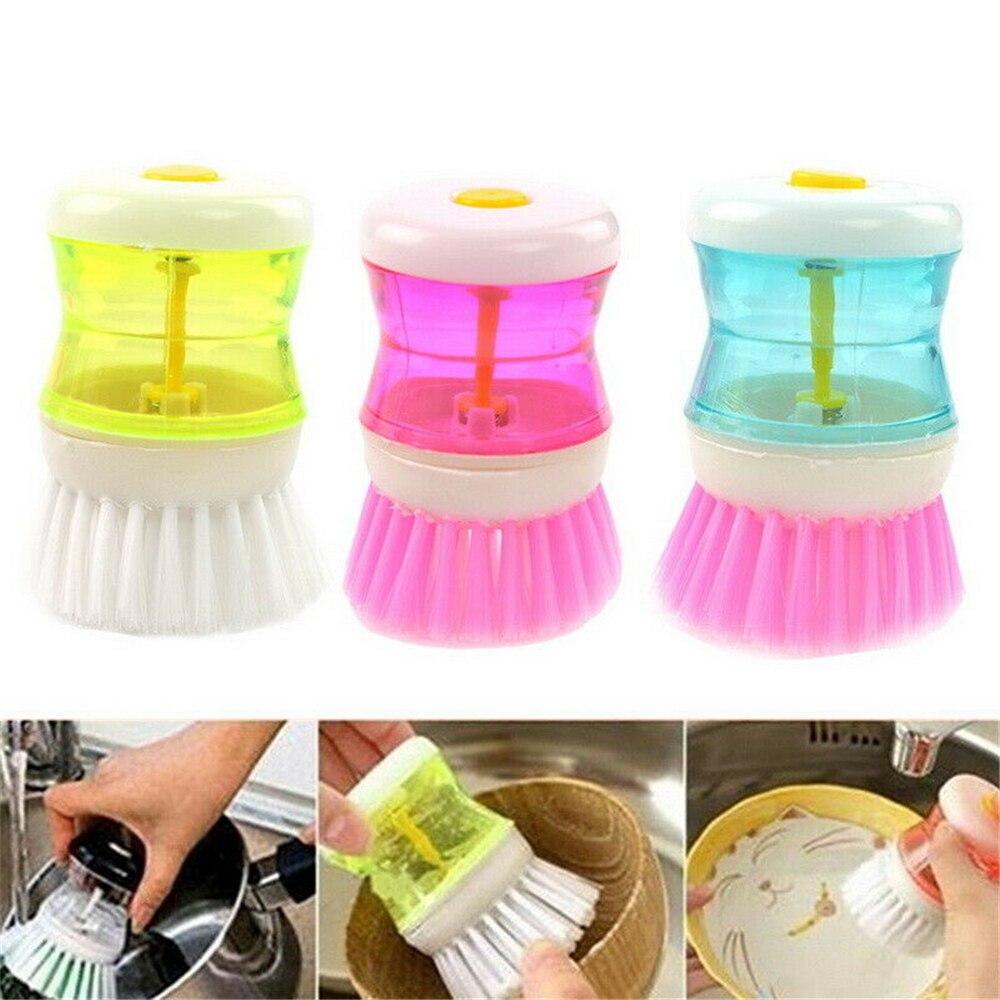
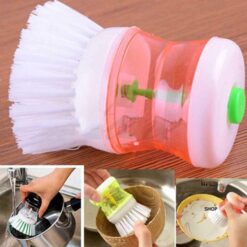
Liquid Soap Dishwasher Brush
Simply open top & add soap.
Protects hands & finger-nails.
Ideal for kitchen,bath,laundry,tires & outdoor jobs
Durable Bristles.
Not to be used for non-stick surfaces
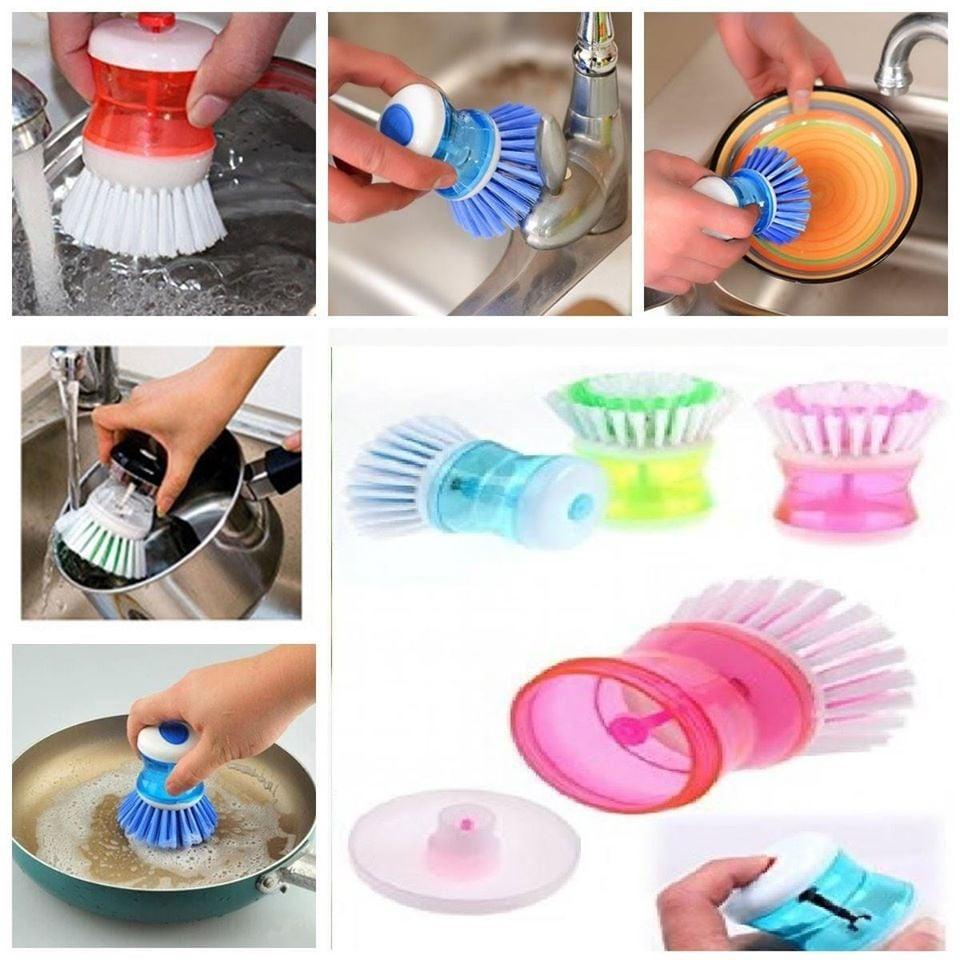
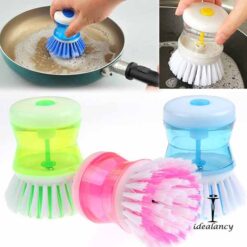
Liquid Soap Dishwasher Brush
- How to use.
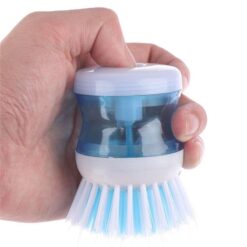
- Twist off cap to open
- Plastic tank for washing up liquid
- Spring loaded button to release washing up liquid to tackle stubborn grease and grime..
- Wet bristles and press LI’L scrub master to dispense soap as needed.
- Release pressure scrub pots,pans,tiles,greasy dishes with ease
Questions and Answers of the customers.
There are no questions yet. Be the first to ask a question about this product.
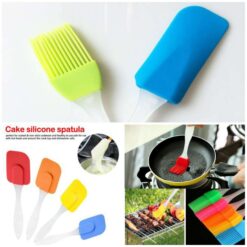
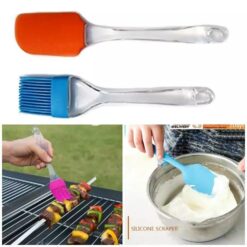
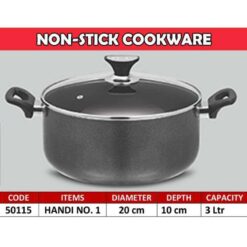
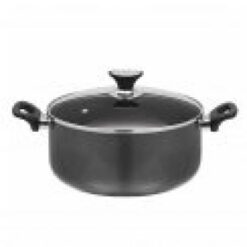
Related products
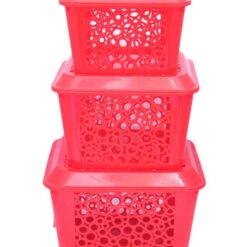
Out of stock
Out of stock

Out of stock